In the world of price action and technical trading, few phenomena draw as much attention as Gap Ups and Gap Downs. These sharp moves in price can offer some of the most profitable opportunities — if you know how to read them correctly.
This guide covers what gaps are, how to trade them, and how to read their behavior using live charts and proven strategies.
What Is a Gap?
A gap on a stock chart occurs when a stock opens at a price significantly different from its previous closing price, leaving a visible space — or gap — on the chart.
Types of Gaps:
- Gap Up: Today’s opening price is higher than yesterday’s high.
- Gap Down: Today’s opening price is lower than yesterday’s low.
These gaps usually reflect strong overnight news, earnings surprises, or global market movements that impact trader sentiment before the market even opens.
Why Gaps Matter
Gaps are not just random occurrences — they often reflect strong sentiment or institutional moves. A well-timed entry based on a gap can lead to rapid profits, but only if you understand the context and volume behind the move.
Four Key Types of Gaps
Not all gaps are created equal. Understanding the type of gap helps determine whether to trade it or fade it.
1. Common Gaps
- Usually occur in sideways markets.
- Often get filled quickly.
- Low volume and little significance.
2. Breakaway Gaps
- Break through strong support or resistance.
- Backed by high volume.
- Signal the start of a new trend.
3. Runaway (Continuation) Gaps
- Appear mid-trend.
- Confirm trend strength.
- Often followed by further price acceleration.
4. Exhaustion Gaps
- Near the end of a move.
- Can signal reversal.
- Typically come with declining volume.
Chart Example: Types of Gaps
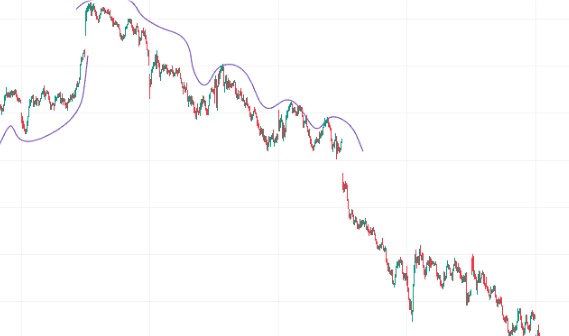
The chart above shows clear examples of breakaway, continuation, and exhaustion gaps. Note how volume and candle size confirm the nature of each move.
Gap Up Trading Strategy
When a stock gaps up, it shows potential bullish momentum, but context is key.
Key Considerations:
- Does the stock open above resistance?
- Is volume higher than average?
- Is the first candle strong and wide?
Trading Setup:
- Wait for the first 5–15 minute candle to close.
- Enter on a breakout or pullback continuation.
- Place a stop loss just below the gap zone.
This chart illustrates a breakaway gap with strong continuation. Note the high volume on the first candle and the clean breakout beyond resistance.
Gap Down Trading Strategy
Gap downs are often driven by fear or negative news, but they can present great short opportunities or reversal setups.
Key Questions:
- Is the stock breaking below support?
- Is there panic-selling volume?
- Are buyers stepping in (reversal) or fleeing (breakdown)?
Trading Setup:
- For shorts: Enter on breakdown continuation after the initial candle.
- For reversals: Look for volume spikes and wicks suggesting support.
📊 [Insert Gap Down Reversal & Breakdown Chart Here]
The chart shows both a failed gap down and a successful short continuation, using volume and price action as clues.
Understanding Gap Fill
A gap fill occurs when the price retraces to the prior day’s close. It’s a common phenomenon but requires specific conditions.
When Do Gaps Get Filled?
- When the gap was emotion-driven, not based on fundamentals.
- When there’s no follow-through volume.
- When resistance or support levels near the gap remain intact.
How to Read Gaps on Charts
To evaluate a gap’s potential, use this checklist:
✅ Mark the gap zone on your chart.
✅ Watch the first 5–15 minute candle.
✅ Check volume compared to average.
✅ Identify support/resistance nearby.
✅ Use candlestick formations (e.g., doji, hammer, engulfing).
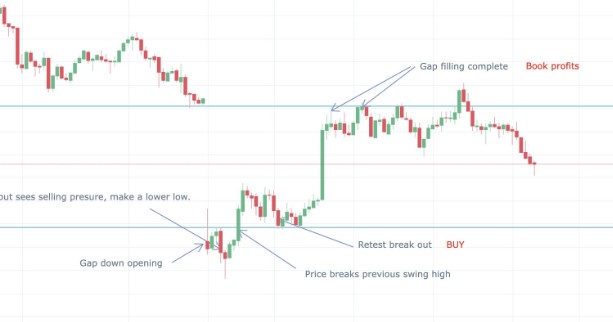
📊 [Insert Annotated Gap Chart Here]
This annotated chart breaks down a full gap trade from setup to exit, using multi-timeframe confirmation.
Final Thoughts
Gap trading can be a high-reward strategy, but only when approached with structure and clarity. Learn to read the story the chart and volume are telling you, and the market will show you the opportunities.
Did you find this guide useful? Let us know what type of strategy or chart pattern you want to learn about next.
📈 Stay informed. Stay sharp. Trade with purpose.
📌 Stock Market Disclaimer
The content presented in this blog is intended solely for educational and informational purposes. The analysis of Gap Up and Gap Down trading strategies, chart interpretations, and market behavior is provided to help readers understand trading concepts and price action techniques. It does not constitute financial, investment, or trading advice.
Stock market investments are subject to market risks. Trading involves substantial risk and may not be suitable for all investors. Past performance is not indicative of future results. The strategies and examples discussed in this blog do not guarantee any specific outcome or profit.
Readers are strongly encouraged to conduct their own research, evaluate their risk tolerance, and consult with a certified financial advisor or professional before making any investment or trading decision.
The publisher of this content shall not be held liable for any loss or damage — direct or indirect — that may arise from the use of the information provided.
By reading this blog, you agree to take full responsibility for your investment decisions.