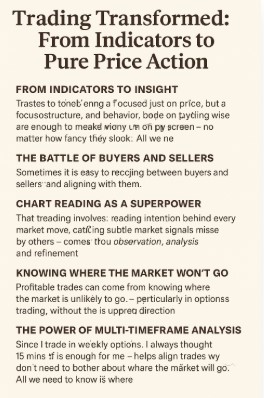
In the world of trading, many begin their journey relying on indicators—RSI, MACD, Bollinger Bands, and the like. But over time, the noise of too many signals can cloud judgment. For those who dig deeper, a powerful realization often emerges: price is the purest form of market truth.
This is a journey of transformation—one where fancy indicators gave way to clean charts, pure price action, and a deep understanding of market psychology.

From Indicators to Insight
There was a time when indicators filled every corner of the trading screen. But when trades didn’t go as expected, doubts would creep in, and strategy would falter. The turning point came with a focused shift to price action trading. Now, not a single indicator distracts from what matters most: price, structure, and behavior.
Understanding support and resistance zones alone is often enough to make consistent profits—especially in weekly option selling, where clarity and decisiveness are critical.
The Battle of Buyers and Sellers
Too often, traders get lost in patterns—flags, pennants, triangles—forgetting that behind every candle is a battle between buyers and sellers. The real edge lies in recognizing who is gaining control and aligning with them.
The key isn’t about predicting the future. It’s about identifying which side has the upper hand—and taking a position alongside them.
Chart Reading as a Superpower
Chart reading is more than spotting patterns—it’s about reading intention behind every move. With practice and discussion, a new skill emerges: catching subtle market signals that others miss.
It’s a superpower that doesn’t come from books—it comes from observation, analysis, and refinement.
Knowing Where the Market Won’t Go
One of the most liberating insights in trading is this: you don’t need to predict where the market will go. Instead, profitable trades often come from knowing where the market is unlikely to go.
This perspective shift is especially powerful in options trading. Selling options in zones where price is unlikely to travel can yield consistent returns—without needing to guess the exact direction.
The Power of Multi-Timeframe Analysis
Many weekly option sellers live on lower timeframes, like the 15-minute chart. But that’s only part of the picture.
A multi-timeframe analysis—starting from the daily or 1-hour chart—helps align trades with the dominant trend. This alignment increases conviction and significantly improves the odds of success.
What looks like a valid setup on a small timeframe may contradict the broader market trend. By zooming out first, traders can make more informed, high-probability decisions.
Final Thoughts
Trading is a craft, and every evolution in your approach brings you closer to consistency. Stripping down charts, focusing on price, understanding buyer-seller dynamics, and learning what the market won’t do—these are the building blocks of a sustainable trading strategy.
Less clutter, more clarity. Less prediction, more observation. And above all, deep respect for what price is telling you—because it never lies.
Disclaimer:
The information provided in this blog is for educational and informational purposes only and should not be considered as financial or investment advice. Trading in the stock or options market involves substantial risk and is not suitable for every investor. Past performance does not guarantee future results. Readers are encouraged to conduct their own research or consult with a qualified financial advisor before making any trading or investment decisions. The strategies and insights shared are based on personal experiences and do not represent any guarantee of success. The author is not responsible for any losses incurred as a result of using the information in this blog.